岡山県の平均気温をPandas、matplotlibでグラフ化する
解析に使うツールとデータの準備
Python pandas プロット機能を使いこなすを参考に、岡山県の平均気温をPandasでグラフ化してみました。今回使用するPythonのデータ解析ライブラリ Pandasは、IPythonで使うと、とても分かりやすく、何度でもやり直しが利きます。
- pandas Python Data Analysis Library
- matplotlib python 2D plotting library
- IPython IPython provides a rich architecture for interactive computing
分析の対象となる岡山県の平均気温のデータは、気象庁のサイトで公開されているので、ダウンロードします。岡山県下の「岡山、倉敷、津山、千屋」の過去1年の平均気温のCSVをダウンロードします。
IPythonで、Pandasを使って解析、matplotlibでグラフを表示する
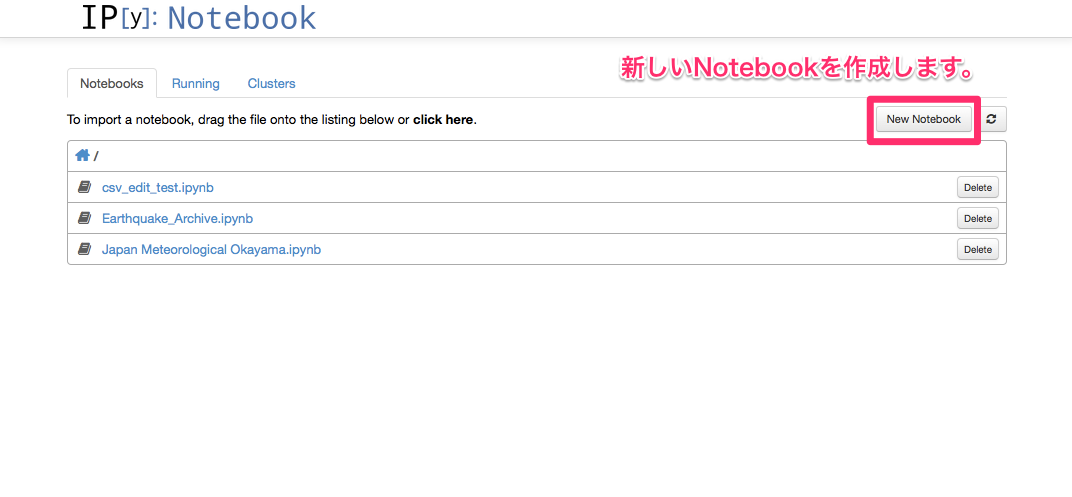
IPythonを起動します。
$ ipython notebook
自分のパソコンのポート8888で起動します。http://localhost:8888/ へアクセスします。

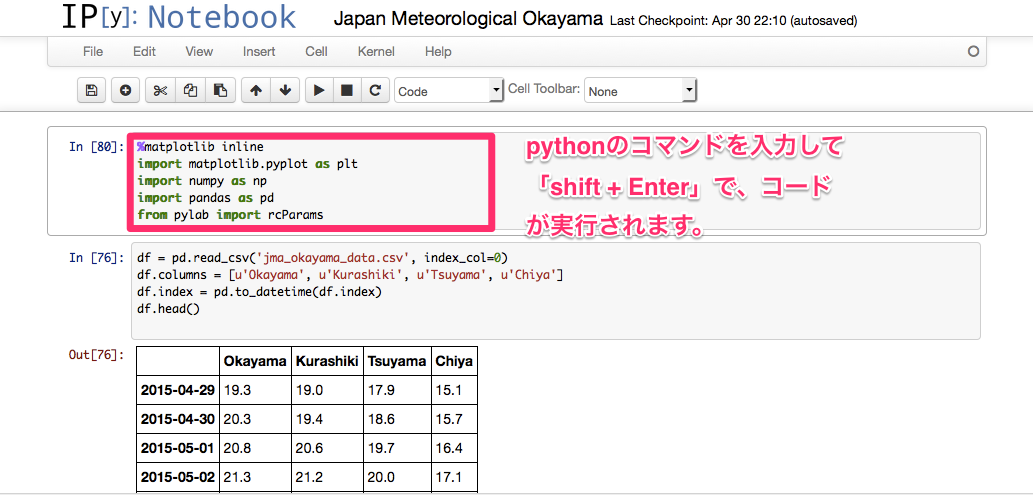
後は、pythonのコードを入力して、実行すれば、その場で結果が表示されます。pythonのコードを修正して、何度でも実行をすることができます。

必要なモジュールのインポート %matplotlib inline は、インラインでグラフを表示するための
%matplotlib inline
import matplotlib.pyplot as plt
import numpy as np
import pandas as pd
from pylab import rcParams』
「岡山、倉敷、津山、千屋」の過去1年の平均気温のCSVを読み込みます。元のCSVのままでは、日付のフォーマットに問題があり、Numbersで読み込んで事前に加工をしました。「YYYY/MM/DD」を「YYYY-MM-DD」に変更しておきます。
df = pd.read_csv('jma_okayama_data.csv', index_col=0)
df.columns = [u'Okayama', u'Kurashiki', u'Tsuyama', u'Chiya']
df.index = pd.to_datetime(df.index)
df.head()
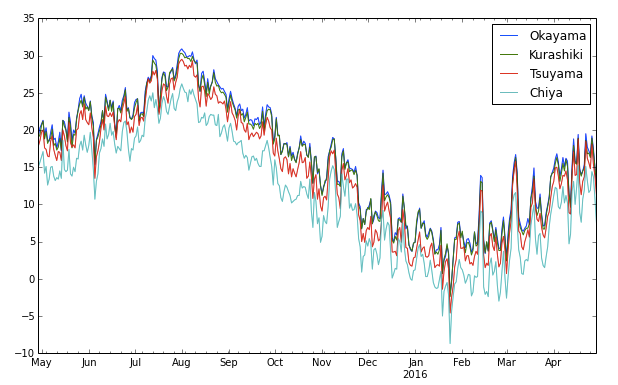
日々の平均気温の変化を折れ線グラフで表示します。
rcParams['figure.figsize'] = 10,6
df.plot()

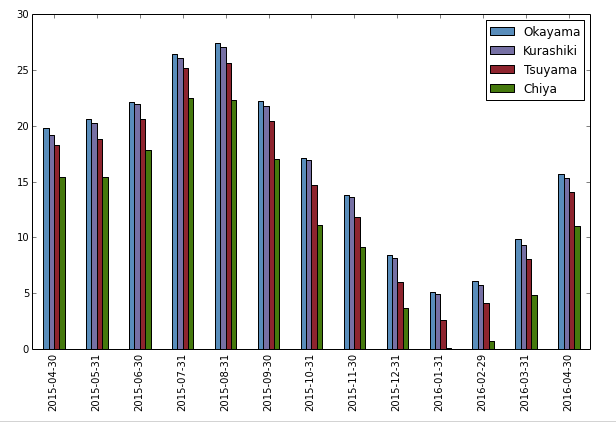
月毎の平均気温の棒グラフを表示します。
rcParams['figure.figsize'] = 10, 6
monthly.index.format()
monthly.index = monthly.index.format()
monthly.plot.bar(color=['#348ABD', '#7A68A6', '#A60628', '#008000'])

About the author and the blog
Masayuki Ariki is a Hobby Programmer and an not enthusiastic blogger, curious about any Python modules, Deep learning, and the web. More...
